


In the previous blog post, we explored the core concepts of OpenTelemetry for Rust. If you missed that post, check it out here. Let's dive into some simple examples to start instrumenting Rust with OpenTelemetry.
Example Applications → Rust OpenTelemetry Examples
Setting Up Jaeger
Before we start instrumenting an application, we need an Observability backend to send our telemetry. The quickest to get started with is Jaeger.
Docker required.
Run the following command:
docker run -d --name jaeger \
  -e COLLECTOR_ZIPKIN_HOST_PORT=:9411 \
  -e COLLECTOR_OTLP_ENABLED=true \
  -p 6831:6831/udp \
  -p 6832:6832/udp \
  -p 5778:5778 \
  -p 16686:16686 \
  -p 4317:4317 \
  -p 4318:4318 \
  -p 14250:14250 \
  -p 14268:14268 \
  -p 14269:14269 \
  -p 9411:9411 \
  jaegertracing/all-in-one:1.47
For a list of what each port is, check out Jaeger Documentation
The TL;DR
16686 frontend
4318(HTTP) and 4317(GRPC) OTLP
Once it's up and running, the Jaeger frontend will be available from http://localhost:16686/
Let’s instrument a simple application:
use rand::Rng;

fn gen_number() -> u32 {
    let mut rng = rand::thread_rng();
    rng.gen()
}

#[tokio::main]
async fn main() -> Result<()> {
    let num = gen_number();
    println!("{}", num);
    Ok(())
}
In this example, a simple function generates a random number and prints it, then returns a result when executed.
How can we instrument this?
Step 1: Adding OpenTelemetry crates
In Cargo.toml add the below crates
[dependencies]
opentelemetry = { version = "0.19.0", features = ["rt-tokio"] }
opentelemetry-otlp = { version="0.12.0",  features = ["tonic", "metrics"] }
opentelemetry-semantic-conventions = { version="0.11.0" }
tokio = { version = "1.0", features = ["full"] }
rand = "0.8.5"
Note we are adding the tokio runtime, tonic and metrics features for the OpenTelemetry crates.
Step 2: Use OpenTelemetry crates
In main.rs add the below
use opentelemetry::{
    global, runtime,
    sdk::{propagation::TraceContextPropagator, trace, Resource},
    trace::{TraceContextExt, TraceError, Tracer},
    Key, KeyValue,
};
use opentelemetry_otlp::WithExportConfig;
use rand::Rng;
Step 3: Initialise a tracer
Within the OpenTelemetry crate, we will implement the traces module. The traces module contains the tracer trait, which tracks and connects our spans to create traces.
To create a tracer:
Initialise an OTLP pipeline with
opentelemetry_otlp::new_pipeline().Specify pipeline builder options
tracing()creates an OTLP tracing pipeline (available in theopentelemetry_otlpcrate)Set the OTLP exporter
tonic()creates a grpc layer to export our tracers (for both metrics and tracing pipelines)set the endpoint to the GRPC OTLP endpoint for Jaeger
"http://localhost:4317"
Set the trace provider configuration.
Set the
SERVICE_NAMEresource (We will leverage opentelemetry_semantic_conventions crate)"your-app-name"You can specify different resources or batch span configurations.
Configure a span exporter and a batch span processor with the specified runtime.
.install_batch(runtime::Tokio)Returns a Tracer
install_batch panics when not called within a tokio runtime.
For optimal performance, batch exporting is recommended. Adding the
rt-tokiofeature to theopentelemetrycrate automatically configures a batch exporter
In main.rs add the below
fn init_tracer() -> Result<trace::Tracer, TraceError> {
    // Initialise OTLP Pipeline
    opentelemetry_otlp::new_pipeline()
        .tracing() // create OTLP tracing pipeline
        .with_exporter(
            opentelemetry_otlp::new_exporter()
                .tonic() // create GRPC layer
                .with_endpoint("http://localhost:4317"), // GRPC OTLP Jaeger Endpoint
        )
        // Trace provider configuration
        .with_trace_config(
            trace::config().with_resource(Resource::new(vec![KeyValue::new(
                opentelemetry_semantic_conventions::resource::SERVICE_NAME,
                "rust-otlp-basic",
            )])),
        )
        .install_batch(runtime::Tokio) // configure a span exporter
}
Step 4: Using the Tracer
To use the tracer:
Set the Propagator so that our traces can build information across multiple services (in this case, a single service)
global::set_text_map_propagator(TraceContextPropagator::new());Initialise the tracer function
let tracer = init_tracer().unwrap();
In main.rs add the below
#[tokio::main]
async fn main() -> Result<(), TraceError> {
    // set the Global Propagator
    global::set_text_map_propagator(TraceContextPropagator::new());

    // intialise the tracer
    let tracer = init_tracer().unwrap();

    let num = gen_number();
    println!("{}", num);
    Ok(())
}
Step 5: Creating Spans
Continuing in main.rs add the below
// create a constant key
const RANDOM: Key = Key::from_static_str("random.value");

#[tokio::main]
async fn main() -> Result<(), TraceError> {
    // set the Global Propagator
    global::set_text_map_propagator(TraceContextPropagator::new());

    // intialise the tracer
    let tracer = init_tracer().unwrap();

    // start a new active span
    tracer.in_span("generating number", |cx| {
        let span = cx.span();
        let num = gen_number();
        span.add_event(
            "Generating Number".to_string(),
            vec![Key::new("number").i64(num.into())],
        );

        // set an active span attribute
        span.set_attribute(RANDOM.i64(10));


        // start a new span
        tracer.in_span("generate another number", |cx| {
            let span = cx.span();
            let num = gen_number();
            span.add_event(
                "Generating Number".to_string(),
                vec![Key::new("number").i64(num.into())],
            )
        })
    });

    // gracefully shutdown the tracer
    global::shutdown_tracer_provider();
    Ok(())
}
The tracer provides an in_span method. The method starts a new span and sets the active span for the given function.
We name the active span.
"generating number"Within the span, we create a reference to the current context
let span = cx.span();Set a span attribute
span.set_attribute(RANDOM.i64(10));There is a list of semantic conventions which are predefined by the opentelemetry project, available from the
opentelemetry-semantic-conventionscrateWithin the span, create another span called
"generate another number"Shutdown the tracer
global::shutdown_tracer_provider();calling this method will gracefully shut down the tracer allowing it to send off any final traces.
Here is the complete main.rs file
use opentelemetry::{
    global, runtime,
    sdk::{propagation::TraceContextPropagator, trace, Resource},
    trace::{TraceContextExt, TraceError, Tracer},
    Key, KeyValue,
};
use opentelemetry_otlp::WithExportConfig;
use rand::Rng;

// create a constant key
const RANDOM: Key = Key::from_static_str("random.value");

fn init_tracer() -> Result<trace::Tracer, TraceError> {
    // Initialise OTLP Pipeline
    opentelemetry_otlp::new_pipeline()
        .tracing() // create OTLP tracing pipeline
        .with_exporter(
            opentelemetry_otlp::new_exporter()
                .tonic() // create GRPC layer
                .with_endpoint("http://localhost:4317"), // GRPC OTLP Jaeger Endpoint
        )
        // Trace provider configuration
        .with_trace_config(
            trace::config().with_resource(Resource::new(vec![KeyValue::new(
                opentelemetry_semantic_conventions::resource::SERVICE_NAME,
                "rust-otlp-basic",
            )])),
        )
        .install_batch(runtime::Tokio) // configure a span exporter
}

fn gen_number() -> u32 {
    let mut rng = rand::thread_rng();
    rng.gen()
}


#[tokio::main]
async fn main() -> Result<(), TraceError> {
    // set the Global Propagator
    global::set_text_map_propagator(TraceContextPropagator::new());

    // intialise the tracer
    let tracer = init_tracer().unwrap();

    // start a new active span
    tracer.in_span("generating number", |cx| {
        let span = cx.span();
        let num = gen_number();
        span.add_event(
            "Generating Number".to_string(),
            vec![Key::new("number").i64(num.into())],
        );

        // set an active span attribute
        span.set_attribute(RANDOM.i64(10));


        // start a new span
        tracer.in_span("generate another number", |cx| {
            let span = cx.span();
            let num = gen_number();
            span.add_event(
                "Generating Number".to_string(),
                vec![Key::new("number").i64(num.into())],
            )
        })
    });

    // gracefully shutdown the tracer
    global::shutdown_tracer_provider();
    Ok(())
}
Step 6: Execute the function and View your traces
- In the root directory, execute
cargo run.
Run the function a few times and check Jaeger UI

Select your service and view your traces.
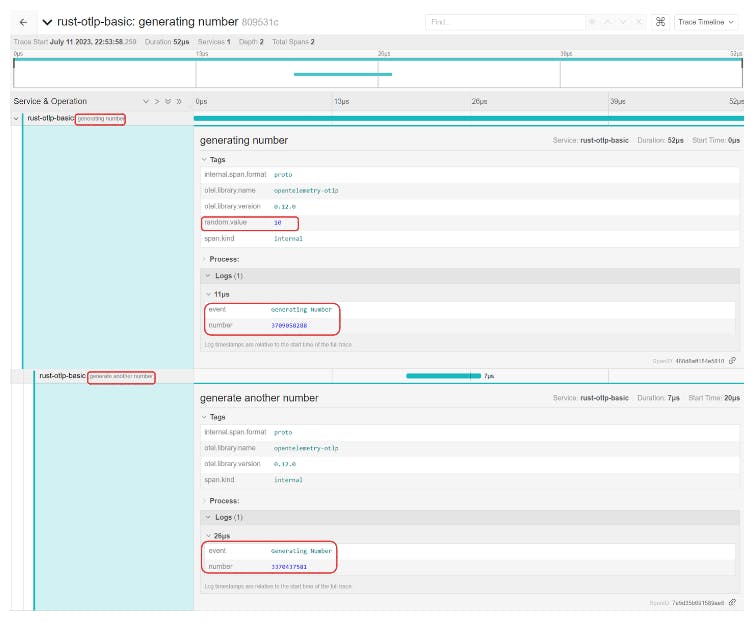
You should see the spans created and the random.value attribute set.
Now let's take a look at setting up OpenTelemetry with Tracing. It shares a similar process to the above but makes things a bit friendlier.
Setting up OpenTelemetry with Tracing
We’ll be using the rust-otlp-tracing example from Rust OpenTelemetry Examples
use rand::Rng;
fn gen_number() {
    let mut rng = rand::thread_rng();
    let number = rng.gen_range(0..=100);
    let value = multiply_number(number);
}

fn multiply_number(number: u32) -> u32 {
    let mut rng = rand::thread_rng();
    let multiplier: u32 = rng.gen_range(0..=5);
    fail();
    number * multiplier
}

fn fail() {
    let fail_vec = vec![8];
}

#[tokio::main]
async fn main() -> Result<(), TraceError> {
    gen_number();
    Ok(())
}
This example is slightly more complex (barely ;/), with a few functions called sequentially.
Step 1: Adding OpenTelemetry and Tracing crates
In Cargo.toml add the below crates
[dependencies]
opentelemetry = { version = "0.19.0", features = ["rt-tokio", "trace"] }
opentelemetry-otlp = { version="0.12.0",  features = ["tonic", "metrics"] }
opentelemetry-semantic-conventions = { version="0.11.0" }
tracing = "0.1.37"
tracing-opentelemetry = "0.19.0"
tracing-subscriber = { version = "0.3.17"}
tokio = { version = "1.0", features = ["full"] }
rand = "0.8.5"
This time round, we’ll include three tracing crates. If you are using
opentelemetryversion 19, you want to use the correspondingtracing-opentelemetryversion 19.
Step 2: Using OpenTelemetry and Tracing crates
In main.rs add the below
use opentelemetry::{
    global, runtime,
    sdk::{propagation::TraceContextPropagator, trace, Resource},
    trace::TraceError,
    KeyValue,
};
use opentelemetry_otlp::WithExportConfig;
use rand::Rng;
use tracing::{error, event, Level};
use tracing_subscriber::prelude::*;
We’ll use the same tracer from the previous example. So we can move on to the
main()function.
Step 3: Using the tracer
Set the Global Propagator.
Initialise the tracer function.
Construct an
opentelemetrylayer to collect spans with the initialised tracerlet telemetry = tracing_opentelemetry::layer().with_tracer(tracer);Create a reusable store for spans with a subscriber.
let subscriber = tracing_subscriber::Registry::default().with(telemetry);To utilise the tracer, we set the global subscriber for the app.
tracing::subscriber::set_global_default(subscriber).unwrap();Invoke our function
gen_number();Shutdown the tracer
global::shutdown_tracer_provider();
In main.rs add the below
async fn main() -> Result<(), TraceError> {
    // set the global propagator
    global::set_text_map_propagator(TraceContextPropagator::new());

    // initalise the tracer
    let tracer = init_tracer().unwrap();

    // create an opentelemetry layer
    let telemetry = tracing_opentelemetry::layer().with_tracer(tracer);

    // create a subscriber
    let subscriber = tracing_subscriber::Registry::default().with(telemetry);

    // set the global subscriber for the app
    tracing::subscriber::set_global_default(subscriber).unwrap();

    gen_number();

    // gracefully shutdown the tracer
    global::shutdown_tracer_provider();
    Ok(())
}
Before executing our app, we must instrument the rest of our functions to create our spans. The tracing crate has macros we can leverage to provide “automatic” instrumentation instead of manually creating spans like before.
Step 4: Instrument Functions
In main.rs update the functions and add the #[tracing::instrument] macro.
// tracing macro
#[tracing::instrument]
fn gen_number() {
    let mut rng = rand::thread_rng();
    let number = rng.gen_range(0..=100);
    let value = multiply_number(number);

    // add metadata to the span
    event!(
        Level::INFO,
        answer = value,
        "otel.status_message" = "multiplied",
        "otel.status_code" = 200
    );
}

// tracing macro
#[tracing::instrument]
fn multiply_number(number: u32) -> u32 {
    let mut rng = rand::thread_rng();
    let multiplier: u32 = rng.gen_range(0..=5);

    // add metadata to the span
    event!(
        Level::INFO,
        multiplier = multiplier,
        "otel.status_message" = "multiplying",
        "otel.status_code" = 200
    );
    fail();
    number * multiplier
}

// tracing macro
#[tracing::instrument]
fn fail() {
    let fail_vec = vec![8];

    // set an error span
    error!("Fail: {fail_vec:?}");
}
The macro will create an info level span if not overridden by default.
There are a few short-hand macros available:
tracing, trace, debug, info, warn, error, event
trace_span, debug_span, info_span, warn_span, error_span
We can call the different macros and add metadata to the spans. In the above example, I add special fields with the otel. Prefix.
otel.name: Override the span name sent to the exporterotel.kind: set a supported span kindotel.status_code: set a supported status codeotel.status_message: Set the span status message.
More information on Special Fields is available from the tracing_opentelemetry crate.
Here is the complete main.rs file
use opentelemetry::{
    global, runtime,
    sdk::{propagation::TraceContextPropagator, trace, Resource},
    trace::TraceError,
    KeyValue,
};
use opentelemetry_otlp::WithExportConfig;
use rand::Rng;
use tracing::{error, event, Level};
use tracing_subscriber::prelude::*;

fn init_tracer() -> Result<trace::Tracer, TraceError> {
    // Initialise OTLP Pipeline
    opentelemetry_otlp::new_pipeline()
        .tracing() // create OTLP tracing pipeline
        .with_exporter(
            opentelemetry_otlp::new_exporter()
                .tonic() // create GRPC layer
                .with_endpoint("http://localhost:4317"), // GRPC OTLP Jaeger Endpoint
        )
        // Trace provider configuration
        .with_trace_config(
            trace::config().with_resource(Resource::new(vec![KeyValue::new(
                opentelemetry_semantic_conventions::resource::SERVICE_NAME,
                "rust-otlp-basic",
            )])),
        )
        .install_batch(runtime::Tokio) // configure a span exporter
}

// tracing macro
#[tracing::instrument]
fn gen_number() {
    let mut rng = rand::thread_rng();
    let number = rng.gen_range(0..=100);
    let value = multiply_number(number);

    // add metadata to the span
    event!(
        Level::INFO,
        answer = value,
        "otel.status_message" = "multiplied",
        "otel.status_code" = 200
    );
}

// tracing macro
#[tracing::instrument]
fn multiply_number(number: u32) -> u32 {
    let mut rng = rand::thread_rng();
    let multiplier: u32 = rng.gen_range(0..=5);

    // add metadata to the span
    event!(
        Level::INFO,
        multiplier = multiplier,
        "otel.status_message" = "multiplying",
        "otel.status_code" = 200
    );
    fail();
    number * multiplier
}

// tracing macro
#[tracing::instrument]
fn fail() {
    let fail_vec = vec![8];

    // set an error span
    error!("Fail: {fail_vec:?}");
}

#[tokio::main]
async fn main() -> Result<(), TraceError> {
    // set the global propagator
    global::set_text_map_propagator(TraceContextPropagator::new());

    // initalise the tracer
    let tracer = init_tracer().unwrap();

    // create an opentelemetry layer
    let telemetry = tracing_opentelemetry::layer().with_tracer(tracer);

    // create a subscriber
    let subscriber = tracing_subscriber::Registry::default().with(telemetry);

    // set the global subscriber for the app
    tracing::subscriber::set_global_default(subscriber).unwrap();

    gen_number();

    // gracefully shutdown the tracer
    global::shutdown_tracer_provider();
    Ok(())
}
Step 5: Execute the function and check Jaeger
- In the root directory, execute
cargo run.

Your trace should contain three spans, one containing an error level span.
Summary
In this blog post, we instrumented Rust with OpenTelemetry. We used both manual and automatic instrumentation and visualized our traces in Jaeger.
If you want to improve your rust applications performance, debug issues faster and ensure your applications stay up, OpenTelemetry is for you!
Hopefully, this blog series has helped you learn more about OpenTelemetry and how to implement it in Rust. Feel free to reach out if you have any questions or want to add more examples to the rust-opentelemetry-examples repo.
Feel free to like, share and comment to help increase the visibility of OpenTelemetry for Rust!